Titanic
About the project
- Project: HEIG-VD
- Year: 2nd year of Bachelor
- Website: titanicsfate.onrender.com
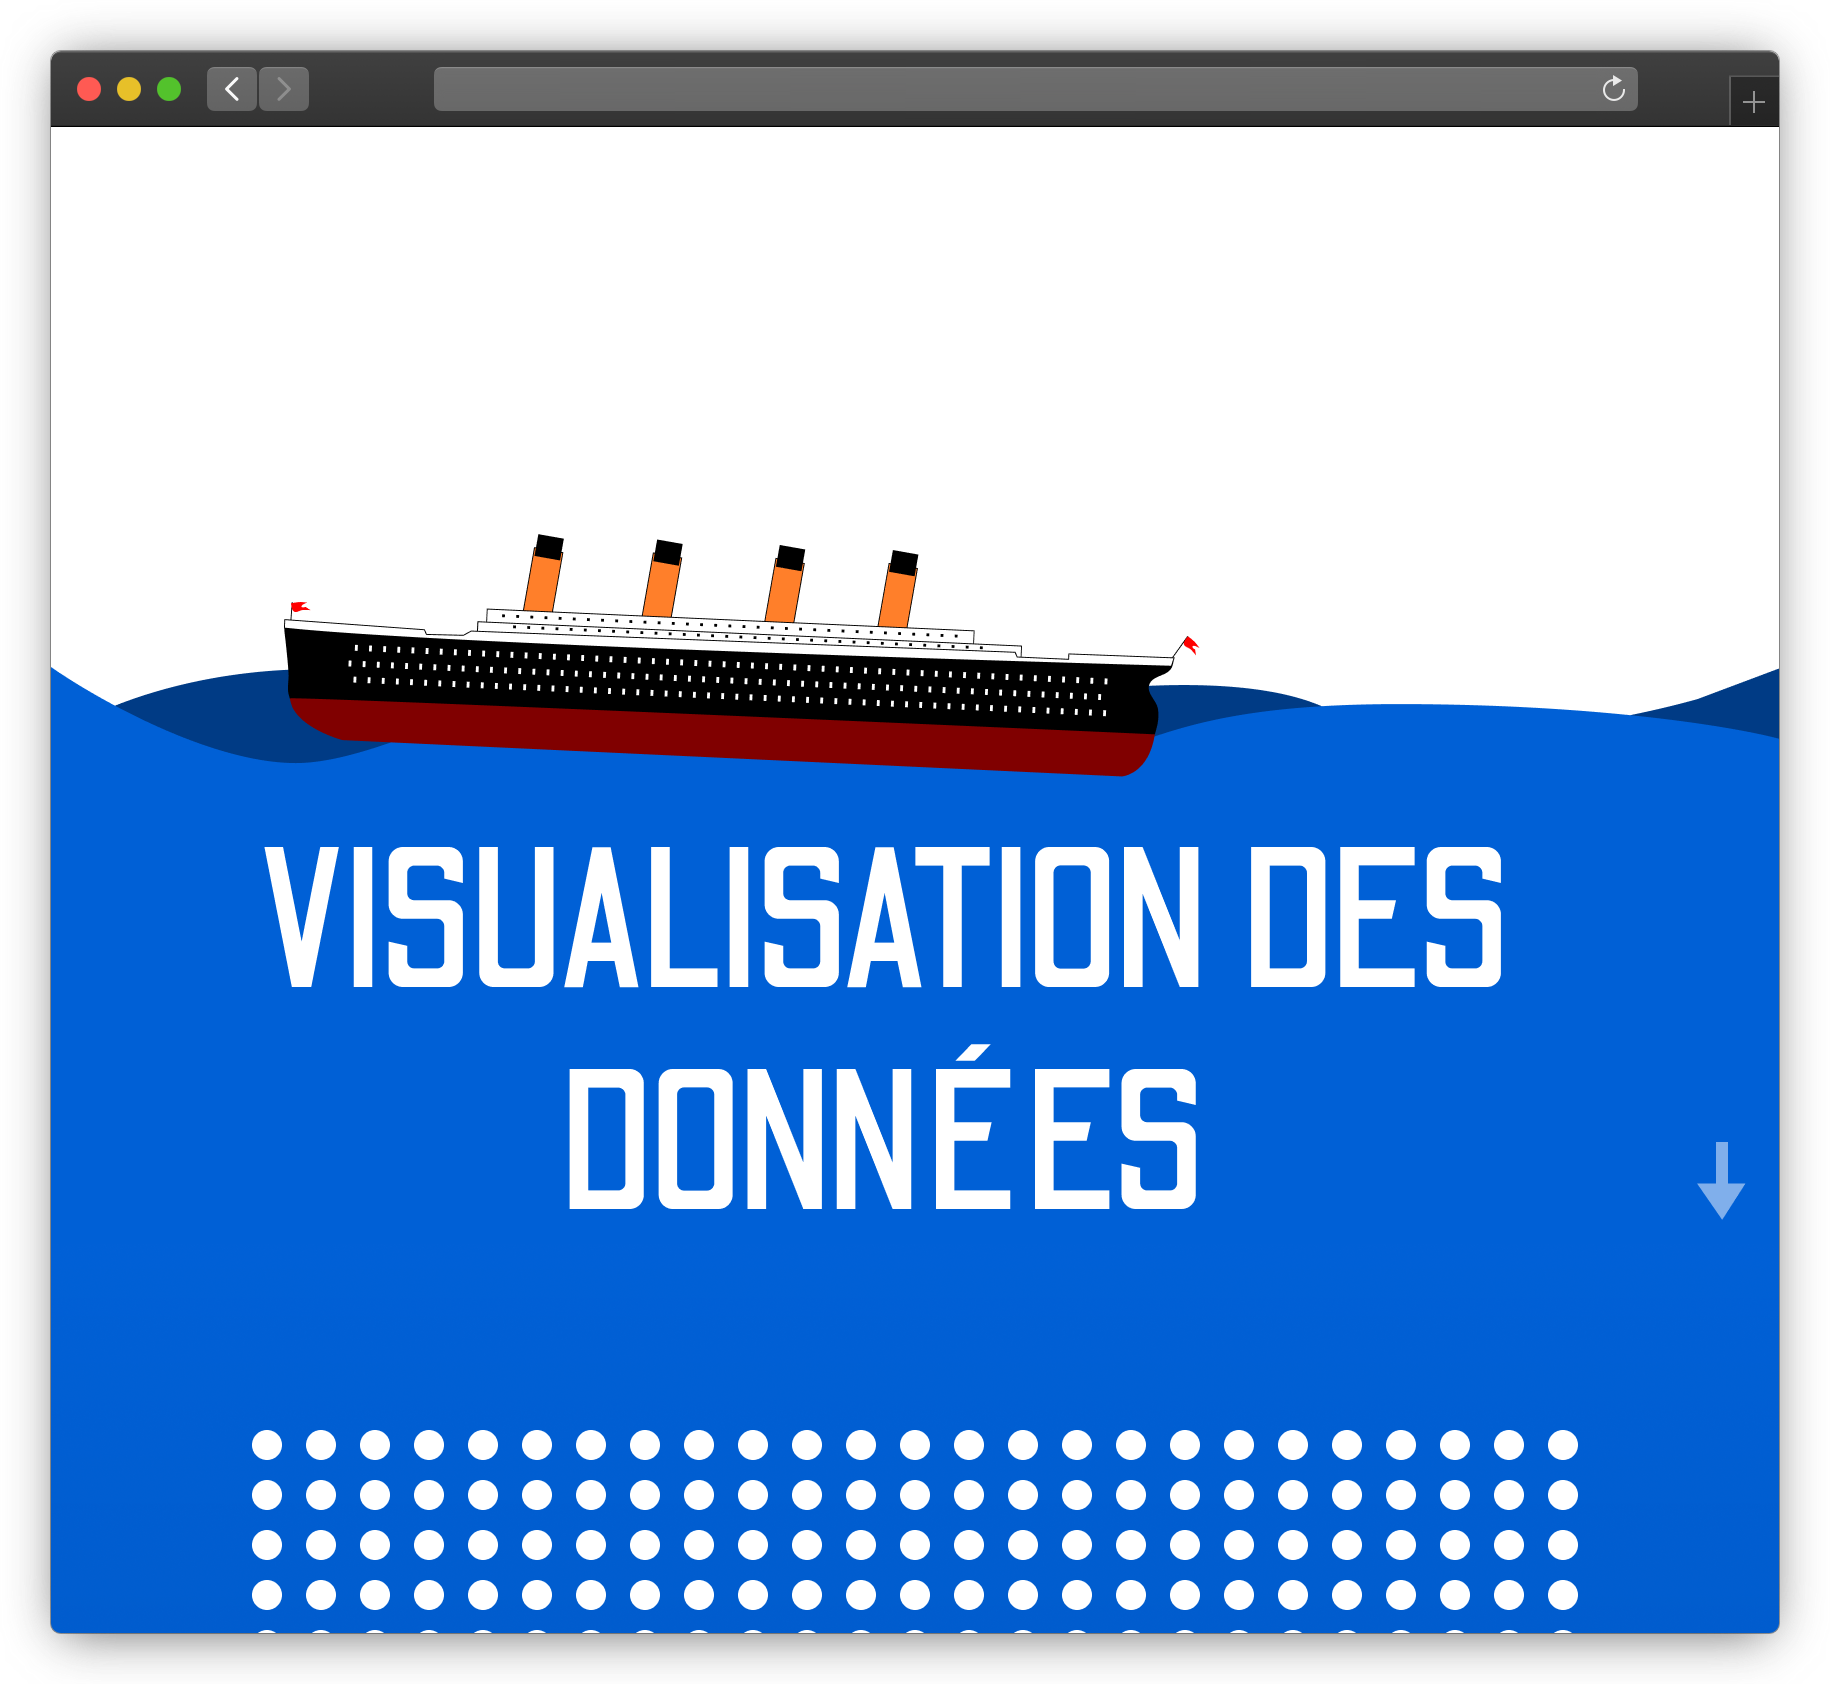
Objective
The purpose of this exercise is to tell a story through data. It can be challenging to make data visually appealing and easy to understand.
Tools & Technologies
HTML, CSS, JavaScript, d3.js, gsap
Challenge
Using data to create a story can be very interesting because it allows you to uncover insights and patterns that may not be immediately apparent just by looking at raw data. One popular tool for creating interactive data visualizations is d3.js. D3 is a JavaScript library that allows you to bind data to the DOM (Document Object Model) and apply transformations to the elements, creating dynamic and interactive visualizations.
With d3, you can create a wide range of visualizations, from basic bar charts and line graphs to more complex visualizations like treemaps and scatterplots. To create a story with data using d3, you can start by selecting the appropriate visualization for the data and story you want to tell, and then use the data and d3's API to create the visualization and add interactivity. It is a challenging but rewarding task to make data attractive and tell a story using data visualization. I learned a lot during this course at school. Data is not just numbers and simple charts. It can be a full story.
Related Projects